


 Pro Benefits
 About
About
 Koşullar
 Gizlilik
 Child Safety & Protection
 Bildirimler
 Ayrush Global It Services Pvt Ltd
Bike Sharing Software for Smarter Fleet Availability
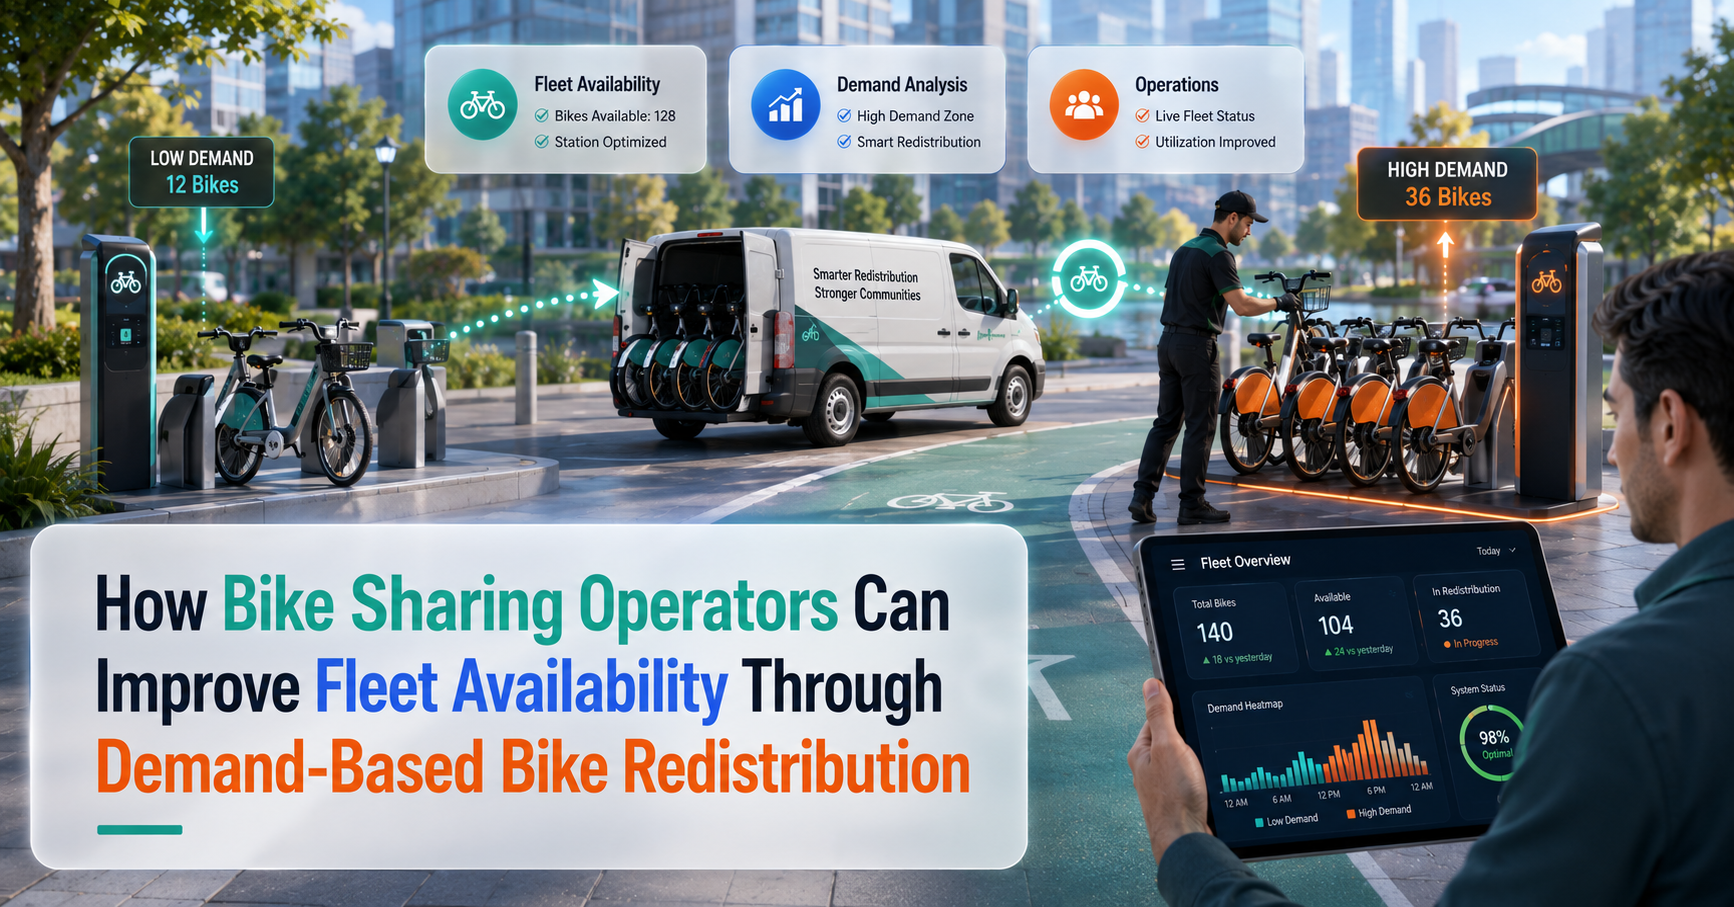
How Bike Sharing Operators Can Improve Fleet Availability Through Demand-Based Bike Redistribution
Riders open a bike sharing app expecting a bike nearby and ready to ride. That expectation seems simple. Yet many operators struggle to meet it consistently across their service area. When that promise breaks, riders rarely complain. They switch to a competitor instead, often without a second thought.
Fleet availability is the single biggest driver of retention for any bike sharing software. Empty zones during peak hours push riders toward other options, and lost rides rarely come back on their own. Companies planning a bike sharing launch need a strategy that keeps bikes where riders actually need them.
This blog explains what demand based redistribution means for operators building a bike sharing system development roadmap. It also shows how this capability fits into fleet strategy from day one.
What Is Demand Based Bike Redistribution
Demand based redistribution means moving bikes based on predicted rider demand. It relies on real data instead of guesswork.
Traditional rebalancing depends on manual checks. Staff drive around and spot empty zones after riders already feel the shortage.
Demand-based redistribution flips this approach. It uses live tracking and historical patterns to predict shortages early.
Why This Matters For Dockless Fleets
Dockless bikes scatter across wide service areas. There are no fixed docking stations to simplify monitoring.
This makes prediction even more valuable for any bike sharing mobile app development project. Operators need to know where riders will need bikes next.
Why Fleet Availability Breaks Down Without It
Bike sharing demand rarely spreads evenly across a city. Commuter patterns create predictable, repeating imbalances.
Morning riders travel toward business districts. Evening riders travel back toward residential areas. Weekend riders cluster near parks and waterfronts.
The Cost Of Ignoring Demand Patterns
Every empty zone represents a lost ride. Every lost ride chips away at rider trust.
Consider these common triggers behind fleet imbalance.
-
Sudden weather changes that shift rider behavior within minutes
-
Local events that pull large groups toward one small area
-
Seasonal shifts that change which neighborhoods see heavy usage
-
Promotional campaigns that spike demand in specific zones overnight
Riders who face repeated unavailability rarely give an app a third try. For operators, this means lost revenue and a shrinking user base.
Core Technology Components That Enable Redistribution
Building strong bike sharing software starts with the right technical foundation. A few components make demand-based redistribution possible.
-
Real-Time GPS Bike Tracking
Operators need a live view of every bike's location. A snapshot updated every few hours is not enough.
Real-time tracking forms the backbone of any serious bike sharing system development effort. It gives operations teams the visibility they need to act quickly.
-
Admin Dashboard With Live Inventory View
A strong dashboard shows bike density across every zone at a glance. This visibility becomes the starting point for every redistribution decision.
-
Reporting And Analytics Tools
Analytics convert raw ride data into usable patterns. Operators can spot which zones run empty at which hours.
They can also identify zones that consistently overflow with unused bikes.
-
Tariff And Promotion Data As Demand Signals
Promotional campaigns can shift ride volume within hours. Redistribution planning needs to factor in these signals early.
How Predictive Data Drives Redistribution Decisions
Data alone does not solve the availability problem. The real value comes from turning data into forecasts operators can act on.
-
Reading Historical Ride Patterns
Historical ride data reveals recurring trends across the fleet. A downtown office zone might empty out by 9 AM on weekdays.
A university campus might see a spike every afternoon when classes end. These patterns repeat, which makes them predictable.
-
Applying Station-Level Demand Prediction
Station-level demand prediction is a growing focus in transportation research. It uses historical and real-time data to forecast exact bike counts needed at specific times.
Even a simplified version of this model gives operators a real edge. It replaces guesswork with a data-backed forecast.
The goal stays simple. Move bikes to where riders will need them before the shortage becomes visible.
Operational Strategies For Redistribution
Once data flags an imbalance, operators need practical ways to respond. Several strategies work well together.
-
Manual Van-Based Rebalancing
This method remains reliable for larger fleets. Staff physically relocate bikes from high-density zones to high-demand zones during off-peak hours.
-
Incentivized Rider Redistribution
Operators can reward riders for ending trips in target zones. This approach turns riders into an informal rebalancing workforce.
-
Zone-Based Rebalancing Triggers
Automated triggers flag a zone once bike count drops below a set threshold. This lets teams act before manual checks even begin.
-
Approved Parking Zones
Guiding riders toward designated parking spots reduces random bike drift. It also keeps redistribution efforts more predictable over time.
The Role Of The Admin Panel In Redistribution Execution
A capable admin panel turns redistribution strategy into daily execution. This is where planning becomes action.
-
Managing Requests And Assignments
Through the admin panel, teams can manage redistribution requests. They can assign specific bikes to specific staff members and track completion status.
-
Tracking Bicycles Across Zones
Bicycle tracking within the panel lets teams monitor the entire fleet at once. This removes the need for scattered field reports.
-
Monitoring Rider Feedback
Rider feedback routed into the same panel helps catch complaints early. A pattern of complaints from one zone often signals a redistribution gap.
This connected view keeps the entire redistribution system proactive and responsive.
-
Measuring Success
Demand based redistribution needs measurable outcomes. Good intentions alone will not improve fleet performance.
Track these four metrics consistently.
-
Bike utilization rate shows how many bikes stay active versus idle
-
Idle time per bike highlights zones that need redistribution focus
-
Ride completion rate reflects how often riders successfully book a bike
-
Rider satisfaction scores offer a qualitative check on availability improvements
Reviewing these metrics regularly helps operators refine strategy over time.
Building This Into Your Platform From Day One
Companies launching a new bike sharing app have a real advantage. They can partner with a reliable bike sharing app development company and design for redistribution from the very start.
Choosing The Right Foundation
This means selecting an admin panel that supports real-time tracking natively. It also means building analytics and reporting into the core system.
Designing For Rider Participation
The rider app should include parking guidance and referral incentives from launch. These features support redistribution without added operational cost.
What would it take for your platform to predict a shortage before a single rider notices it?
That question should guide every decision during the planning stage.
Conclusion
Fleet availability determines whether a bike-sharing platform earns rider loyalty. Demand-based redistribution gives operators the tools to stay ahead of demand.
Real-time tracking, predictive analytics, and a strong admin panel work together here. For companies building a new platform, this capability is a foundational requirement.
Ready to build a platform designed for smarter fleet management from the start? Request a free demo and see how demand-based redistribution fits into your bike sharing system development plan.
 Turkish
 English
 Arabic
 French
 Spanish
 Portuguese
 Deutsch
 Dutch
Dutch
 Italiano
 Russian
 Romaian
 Portuguese (Brazil)
 Greek
Greek
