

How Do Odoo Dashboards Simplify Business Reporting?
Business reporting plays a major role in helping organizations understand their operations, monitor performance, and make informed decisions. However, collecting information from multiple departments and turning it into meaningful reports can often become time-consuming and complicated. This is where Odoo dashboards provide significant value by displaying important business data in one centralized location.
Whether a company manages sales, accounting, inventory, human resources, or customer relationships, dashboards make it easier to monitor key performance indicators (KPIs) without manually reviewing numerous reports. For those new to the platform, understanding how Odoo dashboards work for beginners is the first step toward improving business reporting and decision-making.
What Are Odoo Dashboards?
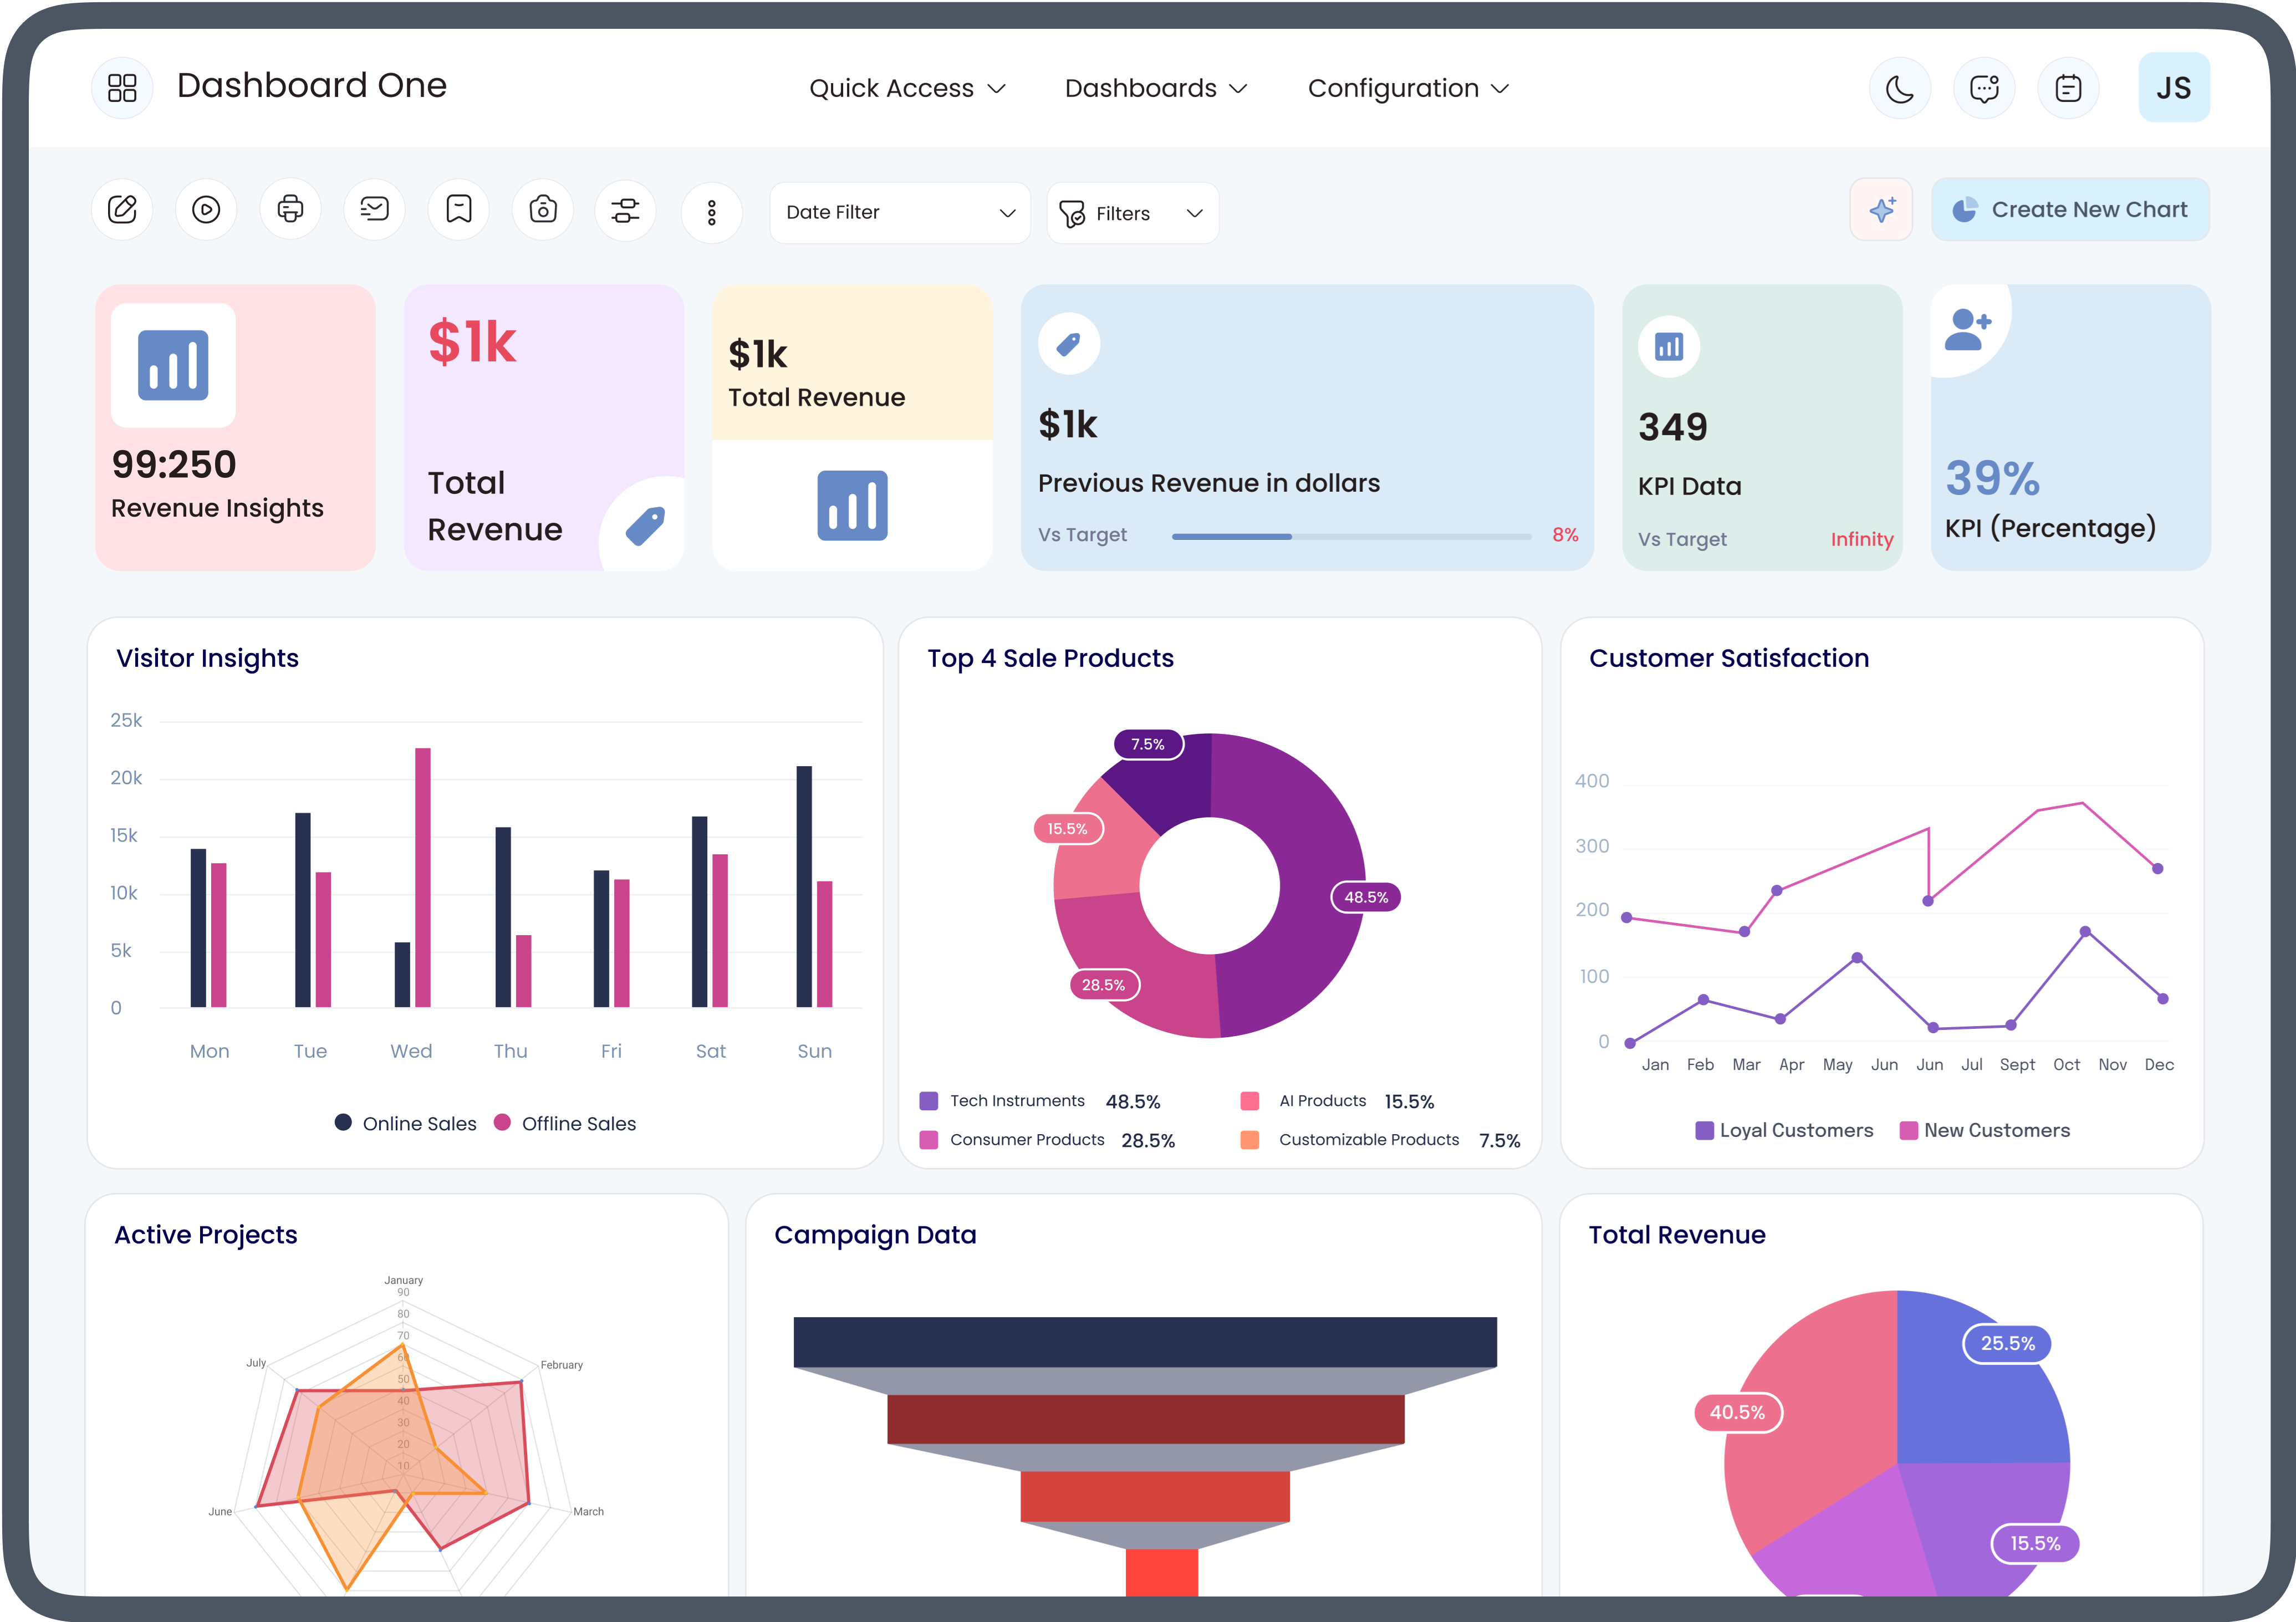
Odoo dashboards are interactive visual reporting tools within the Odoo ERP system. They collect information from different business modules and display it using charts, graphs, tables, scorecards, and other visual components.
Instead of searching through multiple menus or exporting spreadsheets, users can instantly view business performance from a single screen. These dashboards update as business data changes, providing a real-time overview of operations.
Organizations use dashboards to monitor:
-
Sales performance
-
Revenue trends
-
Inventory levels
-
Purchase orders
-
Customer activities
-
Employee productivity
-
Financial summaries
-
Project progress
Having all this information in one place makes reporting faster and easier.
How Odoo Dashboards Work for Beginners
Many new users wonder how Odoo dashboards work for beginners because ERP systems often appear complex at first. Fortunately, Odoo simplifies reporting by presenting business information in an organized visual format.
A beginner typically starts by logging into Odoo and opening a dashboard related to their department. Instead of reading long reports, they immediately see visual summaries such as:
-
Sales charts
-
Revenue graphs
-
Outstanding invoices
-
Inventory quantities
-
Purchase trends
-
Customer activities
Users can click on charts to access detailed records behind the numbers. This interactive approach allows beginners to explore business data without requiring advanced reporting skills.
As users become more familiar with the platform, they can customize dashboards to display the information most relevant to their daily work.
Centralizing Business Information
One of the biggest advantages of Odoo dashboards is their ability to centralize information from different business functions.
Instead of checking separate modules individually, businesses can monitor multiple operations through one reporting interface.
Examples include:
-
Sales performance alongside customer invoices
-
Inventory availability with purchase orders
-
Accounting information with payment status
-
Project progress with employee activities
Centralized reporting saves time while improving overall visibility across departments.
Real-Time Reporting Improves Decision-Making
Business conditions change throughout the day. New orders arrive, payments are received, inventory changes, and customer requests continue to grow.
Traditional reports often become outdated shortly after they are generated. In contrast, Odoo dashboards display updated information as business records change.
Real-time reporting helps managers:
-
Identify sales opportunities
-
Monitor inventory shortages
-
Review pending invoices
-
Track purchase orders
-
Observe project completion
-
Respond to operational issues quickly
Having immediate access to updated information supports faster and more confident decision-making.
Visual Reports Are Easier to Understand
Large spreadsheets containing hundreds of rows can be difficult to analyze quickly. Visual reporting simplifies complex information.
Odoo dashboards commonly use:
-
Bar charts
-
Pie charts
-
Line graphs
-
KPI indicators
-
Tables
-
Progress bars
-
Activity summaries
These visual elements allow users to recognize trends without spending hours reviewing raw data.
Even employees with limited reporting experience can understand business performance more easily.
Dashboard Customization for Different Roles
Different employees require different information.
Sales managers focus on customer activity, while accountants prioritize financial reporting. Warehouse teams need inventory updates, whereas executives often monitor company-wide performance.
Odoo dashboards allow businesses to customize reports according to user roles.
Examples include:
Sales Dashboard
-
Sales orders
-
Quotations
-
Revenue tracking
-
Customer pipeline
-
Monthly sales trends
Finance Dashboard
-
Outstanding invoices
-
Cash flow
-
Expenses
-
Vendor payments
-
Financial summaries
Inventory Dashboard
-
Stock availability
-
Incoming shipments
-
Product movements
-
Warehouse performance
Human Resources Dashboard
-
Employee attendance
-
Leave requests
-
Recruitment progress
-
Workforce statistics
This flexibility ensures every department sees the information most relevant to its responsibilities.
Reducing Manual Reporting
Manual reporting often requires employees to:
-
Export spreadsheets
-
Combine data
-
Perform calculations
-
Create charts
-
Update reports repeatedly
This process consumes valuable time and increases the chance of errors.
With Odoo dashboards, much of this reporting happens automatically. Information updates as users enter transactions into the system.
Automation allows staff to spend less time preparing reports and more time analyzing results.
Better KPI Monitoring
Every organization measures success using Key Performance Indicators (KPIs).
Examples include:
-
Sales revenue
-
Customer retention
-
Order completion
-
Inventory turnover
-
Invoice collections
-
Purchase costs
-
Employee productivity
Odoo dashboards display KPIs in an easy-to-read format, helping businesses monitor progress toward operational goals.
Managers can quickly identify areas performing well and those requiring attention.
Improved Collaboration Across Departments
Business reporting often involves multiple departments sharing information.
Sales teams generate orders.
Accounting processes invoices.
Inventory fulfills products.
Customer service handles support requests.
When departments use separate reporting methods, communication becomes slower.
Odoo dashboards improve collaboration by giving authorized users access to shared business information. Everyone works with consistent, up-to-date data, reducing confusion and improving teamwork.
Easier Report Filtering
Businesses often need reports for specific periods or conditions.
Instead of creating new reports every time, dashboards allow users to filter information quickly.
Common filters include:
-
Date range
-
Product category
-
Salesperson
-
Customer
-
Warehouse
-
Company branch
-
Project
-
Department
Filtering allows users to focus on exactly the information they need.
Mobile Access to Business Reports
Modern businesses require flexibility.
Managers frequently travel or work remotely, making mobile reporting increasingly valuable.
Many Odoo dashboard views are accessible through mobile devices, allowing users to monitor business performance without returning to the office.
This accessibility supports faster decision-making regardless of location.
How Beginners Can Start Using Odoo Dashboards
Learning how Odoo dashboards work for beginners becomes easier by following a structured approach.
New users should:
-
Learn basic Odoo navigation.
-
Explore department-specific dashboards.
-
Understand common charts and KPIs.
-
Practice filtering reports.
-
Click charts to review detailed records.
-
Customize dashboard layouts when needed.
-
Review dashboards regularly to monitor business performance.
With consistent use, beginners become comfortable interpreting business data through visual reporting.
Best Practices for Using Odoo Dashboards
Businesses can maximize dashboard effectiveness by following several best practices.
These include:
-
Display only relevant KPIs.
-
Keep dashboard layouts simple.
-
Review dashboards regularly.
-
Update business records accurately.
-
Limit unnecessary widgets.
-
Customize reports for each department.
-
Train employees on dashboard navigation.
-
Monitor trends instead of isolated numbers.
Following these practices improves reporting quality while supporting better business decisions.
Common Business Benefits
Organizations that effectively use Odoo dashboards often experience several operational improvements.
These include:
-
Faster reporting
-
Improved visibility
-
Better decision-making
-
Simplified performance monitoring
-
Increased operational efficiency
-
Enhanced collaboration
-
Reduced manual reporting
-
Easier access to business information
-
Better resource planning
-
More organized management reporting
These benefits make dashboards valuable tools for businesses of all sizes.
Conclusion
Business reporting becomes far more efficient when information is presented clearly, accurately, and in real time. Odoo dashboards simplify reporting by bringing together data from multiple departments into a single, easy-to-understand interface. Visual charts, automated updates, customizable layouts, and centralized information help businesses monitor performance without relying on complex manual reports.
For organizations just beginning their ERP journey, understanding how Odoo dashboards work for beginners provides a strong foundation for using reporting tools effectively. As users become familiar with dashboard features, they can analyze business performance more confidently, identify trends more quickly, and support smarter operational decisions across every department.
